
Project Overview: README.md
Data Gathering: consolidate_data.ipynb
Analysis: EDA.working_data.ipynb
Tableau Dashboard:
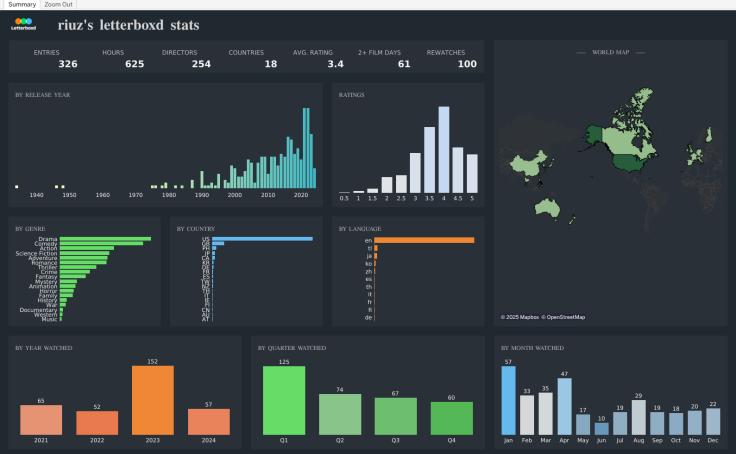
Letterboxd All-Time Stats
public.tableau.com
Letterboxd Data Analysis Project
Table of Contents
- Letterboxd Data Analysis Project
- Table of Contents
- Introduction
- Project Objectives | Business Questions
- Data Preparation
- Exploration and Visualization
- Insights and Findings
- 1. Targeted Genre Exploration:
- 2. Rewatch Strategy:
- 3. Director and Actor Emphasis:
- 4. Support for Local Cinema:
- 5. High-Rating Patterns:
- Technologies Used
- Future Directions
- General Information
Introduction
Welcome to my data analysis project, where I delve into my personal movie-watching habits using my Letterboxd diary. This exploration is powered by enriching the dataset with extensive metadata from the TMDb API and visualizing it through Python and Tableau. This project aims to uncover patterns and insights that inform future film recommendations, demonstrating my capacity to translate personal data into actionable insights. Letterboxd, a platform for film enthusiasts, serves as the foundation for this analysis, illustrating the potential of storytelling through data in making informed viewing choices.
Project Objectives | Business Questions
- Viewing Habits:
- What are the most common genres watched?
- How have viewing patterns changed over time?
- What are the most watched directors, actors, or writers?
- What are some insights into the movies I end up rewatching?
- Movie Ratings:
- What is the distribution of movie ratings?
- Are there particular genres or directors that consistently receive higher ratings?
- Correlations and Insights:
- Is there a correlation between the length of a movie and its rating?
- Are certain genres or types of movies more popular during specific seasons or months?
- Does watching movies from certain countries or in certain languages correlate with higher enjoyment or ratings?
- Are newer movies rated more favorably than older ones?
Data Preparation
326 entries were first extracted from my Letterboxd account as a CSV file with basic movie details like title, release year, and ratings. I then enriched this data using the TMDb API to include genres, runtime, and cast details, as detailed in the consolidate_data.ipynb Jupyter Notebook. The data cleaning phase involved removing duplicates, handling missing values, converting data types for analysis, and merging the TMDb data with the Letterboxd exports. For a detailed walkthrough of the cleaning procedures, refer to the consolidate_data.ipynb notebook. There are also three additional tables for genres, directors, and origin countries; pivoted values to facilitate analysis.
Exploration and Visualization
A comprehensive analysis was conducted to understand the dataset's structure and to uncover any underlying patterns. Key focus areas included:
- Counts by watch-date and release-date.
- Genre popularity and ratings distribution.
- Top directors and actors by movie count.
- Insights on rewatches and ratings.
- Deep dives into highly rated movies and their attributes.
Check out
EDA.working_data.ipynbfor detailed exploratory steps.
The insights derived from the analysis were visualized through engaging graphs and interactive dashboards in Tableau, accessible here. Highlights include KPI summaries and detailed genre, watch-date, and release-date analytics.
Insights and Findings
The project revealed fascinating insights such as my preference trends over different genres and how my movie ratings correlate with each rewatch/cast & crew. Here is what I discovered:
1. Targeted Genre Exploration:
- Discovery: While Drama, Comedy, Action, Science Fiction, Adventure, Romance, Thriller, and Crime dominate my viewing habits, I've developed a higher appreciation for less-watched genres like Music, War, History, and Mystery.
- Action: Intentionally seek out and watch more films from these underrepresented genres to diversify my cinematic experience and potentially discover new favorites.
2. Rewatch Strategy:
- Discovery: My ratings generally increase on rewatch, particularly for films initially rated above 3 stars, while some like “Train to Busan” rated lower. This insight is complemented by the finding that movies with initially high ratings are more likely to be rewatched and often maintain or improve in ratings.
- Action: Implement a strategy to rewatch films I rated lower than 3 stars to see if my perceptions change over time, providing deeper insights into my rating patterns and preferences.
3. Director and Actor Emphasis:
- Discovery: Quentin Tarantino, and Denis Villeneuve are the most watched directors. Samuel L. Jackson, Brad Pitt, J.K. Simmons, Chris Pratt, Scarlett Johansson, and Willem Dafoe are the most watched actors.
- Action: Explore more films by directors with a distinct style, especially those I enjoy but haven’t watched much. Also, consider watching more films featuring under-appreciated actors who have positively surprised me.
4. Support for Local Cinema:
- Discovery: There's a predominance of US-origin films in my watch history. Making up 85.58% of the entries, while PH-origin movies are only about 3.68%.
- Action: Actively seek out films produced in the Philippines to balance my viewing habits and support local industry growth.
5. High-Rating Patterns:
- Discovery: High ratings are often given to genres like Music, War, History, Mystery, Family, and Drama; directors like Christopher Nolan, Richard Linklater, Richard Curtis, Luca Guadagnino, and Denis Villeneuve have at least two watched-moves that were highly rated; actors like Michael Stuhlbarg, Ethan Hawke, Jake Gyllenhaal, Dave Bautista, Linda Cardellini, Kyle Bornheimer, Haruka Abe, Tom Stourton, Julie Delpy, Angela Bassett, and Domhnall Gleeson are highly rated.
- Action: Dive into movies with these specific attributes to see if my interest aligns with these high ratings. If not, I could normalize my data to provide a deeper understanding of my preferences.
Technologies Used
- Python (Pandas, Matplotlib)
- Jupyter Notebook
- Excel
- Tableau
Future Directions
- Development of a web application to interactively explore the data of other people's movie diaries.
- Not all business questions were answered; I thought of additional business questions that could be answered with the data after finishing the project. Did not pursue answering them due to time constraints.
- Deepclean the code and optimize for performance.
- Define functions to reduce code replication.
- Utilize the
tmdbsimplePython library for data retrieval. - Minimize file generation and manual data editing.
- Optimize API requests for efficiency.
- Enhance data update capabilities.
General Information
For more insights and visual presentations, check out the Letterboxd All-Time Stats - Tableau Workbook.
For more about my projects and data journey, visit my Portfolio.
Project Overview: README.md
Data Gathering: consolidate_data.ipynb
Analysis: EDA.working_data.ipynb
Tableau Dashboard:
Letterboxd All-Time Stats
public.tableau.com